Dashboard widgets - Main tab (KPI)
When the dashboard is first displayed, the default Date range is This year.
This can be changed using the Date range button above the dashboard widgets.
Financial
Net revenue
| Description | Displays total Net revenue (Sales - Returns) for the date range. |
|---|
Gross profit
| Description | Displays Gross profit (Net revenue - Net cost) for the date range. |
|---|
Net HA revenue
| Description | Displays Net HA revenue (HA sales - HA returns) for the date range. |
|---|
Net HA cost
| Description | Displays Net HA cost (Cost of HA sales - Cost of HA returns) for the date range. |
|---|
Order backlog
| Description | Displays potential revenue from all undelivered orders (new orders as well as repairs) |
|---|
Unit sales
Gross units fit
| Description | Displays the total number of hearing aids fit during the date range |
|---|
Net units fit
| Description | Displays the net hearing aids fit (total units fit - units returned - units exchanged) during the date range |
|---|
Returned units
| Description | Displays the total number of hearing aids returned during the date range |
|---|
Exchanged units
| Description | Displays the total number of hearing aids exchanged during the date range |
|---|
Return rate
| Description | Displays the return rate (units returned / total units fit) during the date range |
|---|
Exchange rate
| Description | Displays the exchange rate (units exchanged / total units fit) during the date range |
|---|
ASP
| Description | Displays the average sale price for units fit (excluding those returned or exchanged) during the date range Note: For Canadian clinics, units covered by third parties with special pricing are excluded from this calculation, to avoid artificially skewing the ASP downward. |
|---|
Sales conversion
Opportunity conversions (funnel)
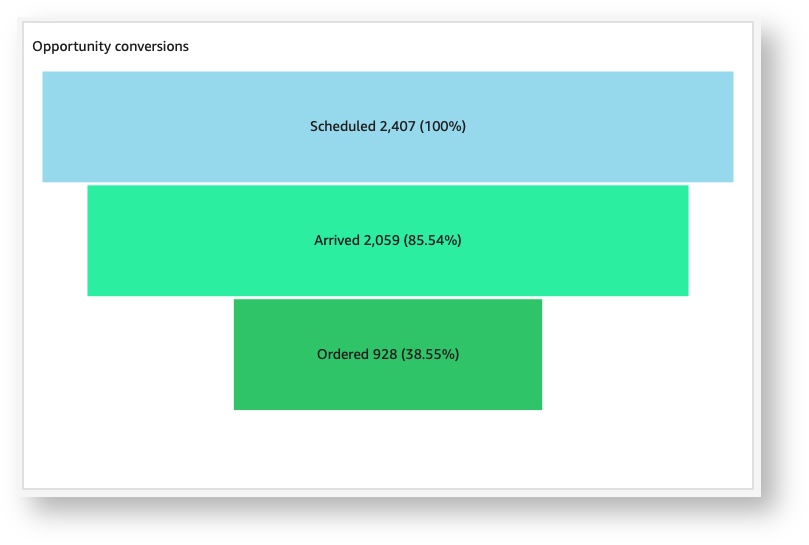
| Description | Displays a funnel which includes all appointments during the date range marked as Sales opportunities. The funnel stages are:
All hearing aid orders are considered, regardless of whether they were eventually invoiced, or whether the ordered aids were eventually returned or exchanged. |
|---|
Opportunity closing rate
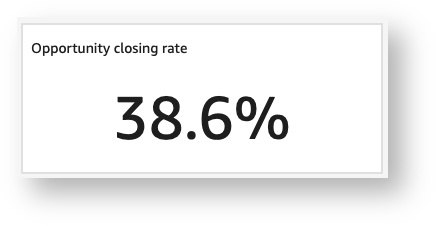
| Description | Displays the percentage of appointments during the date range marked as Sales opportunities which were followed by a hearing aid order for the patient within 30 days of the appointment. All hearing aid orders are considered, regardless of whether they were eventually invoiced, or whether the ordered aids were eventually returned or exchanged. |
|---|
Binaural rate
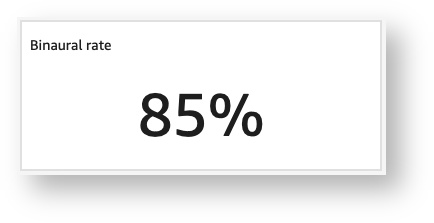
| Description | Displays the percentage of binaural fittings during the date range. Only invoiced units are included in the calculation, and units which were exchanged or returned are also excluded. |
|---|
Patients
Active patients
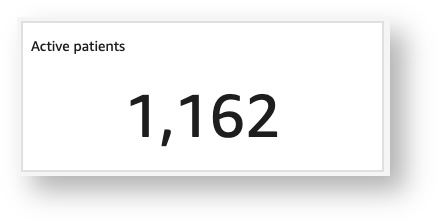
| Description | Displays the current number of active patients. Does not consider date range selected. |
|---|
New patients
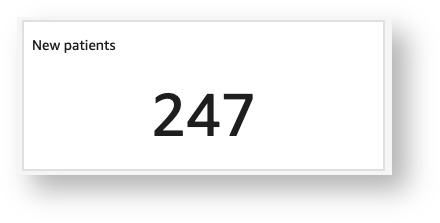
| Description | Displays the number of new patients (patients entered into the Blueprint database) during the date range |
|---|
New patients (past 12 months)
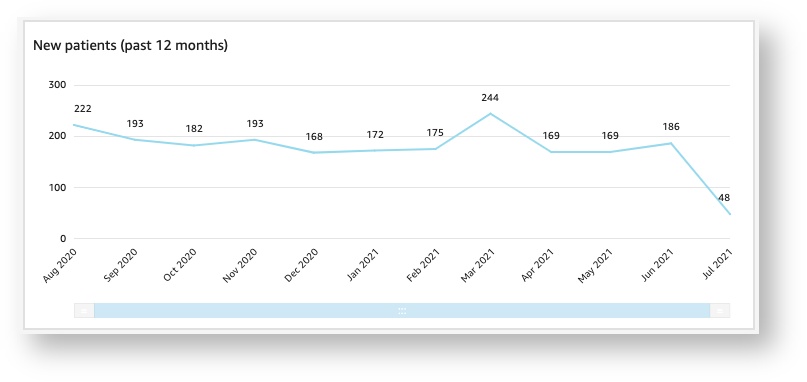
| Description | Displays a line chart representing the number of new patients during each of the past 12 months. |
|---|
Other
No show rate
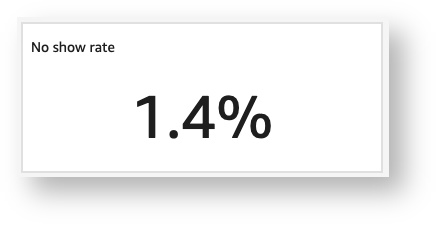
| Description | Displays the percentage of appointments during the date range with status No show |
|---|
Order backlog details
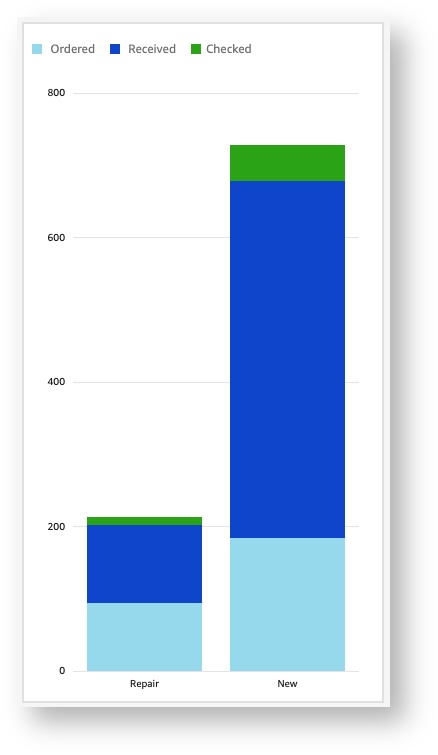
| Description | Displays the number of hearing aids currently on order (both repairs and new orders), broken down by order status:
|
|---|
Guest attendance rate
| Description | Displays the percentage of appointments during the date range that have the Companion present setting checked for sale opportunity appointments only. |
|---|