Versions Compared
Key
- This line was added.
- This line was removed.
- Formatting was changed.
Overview
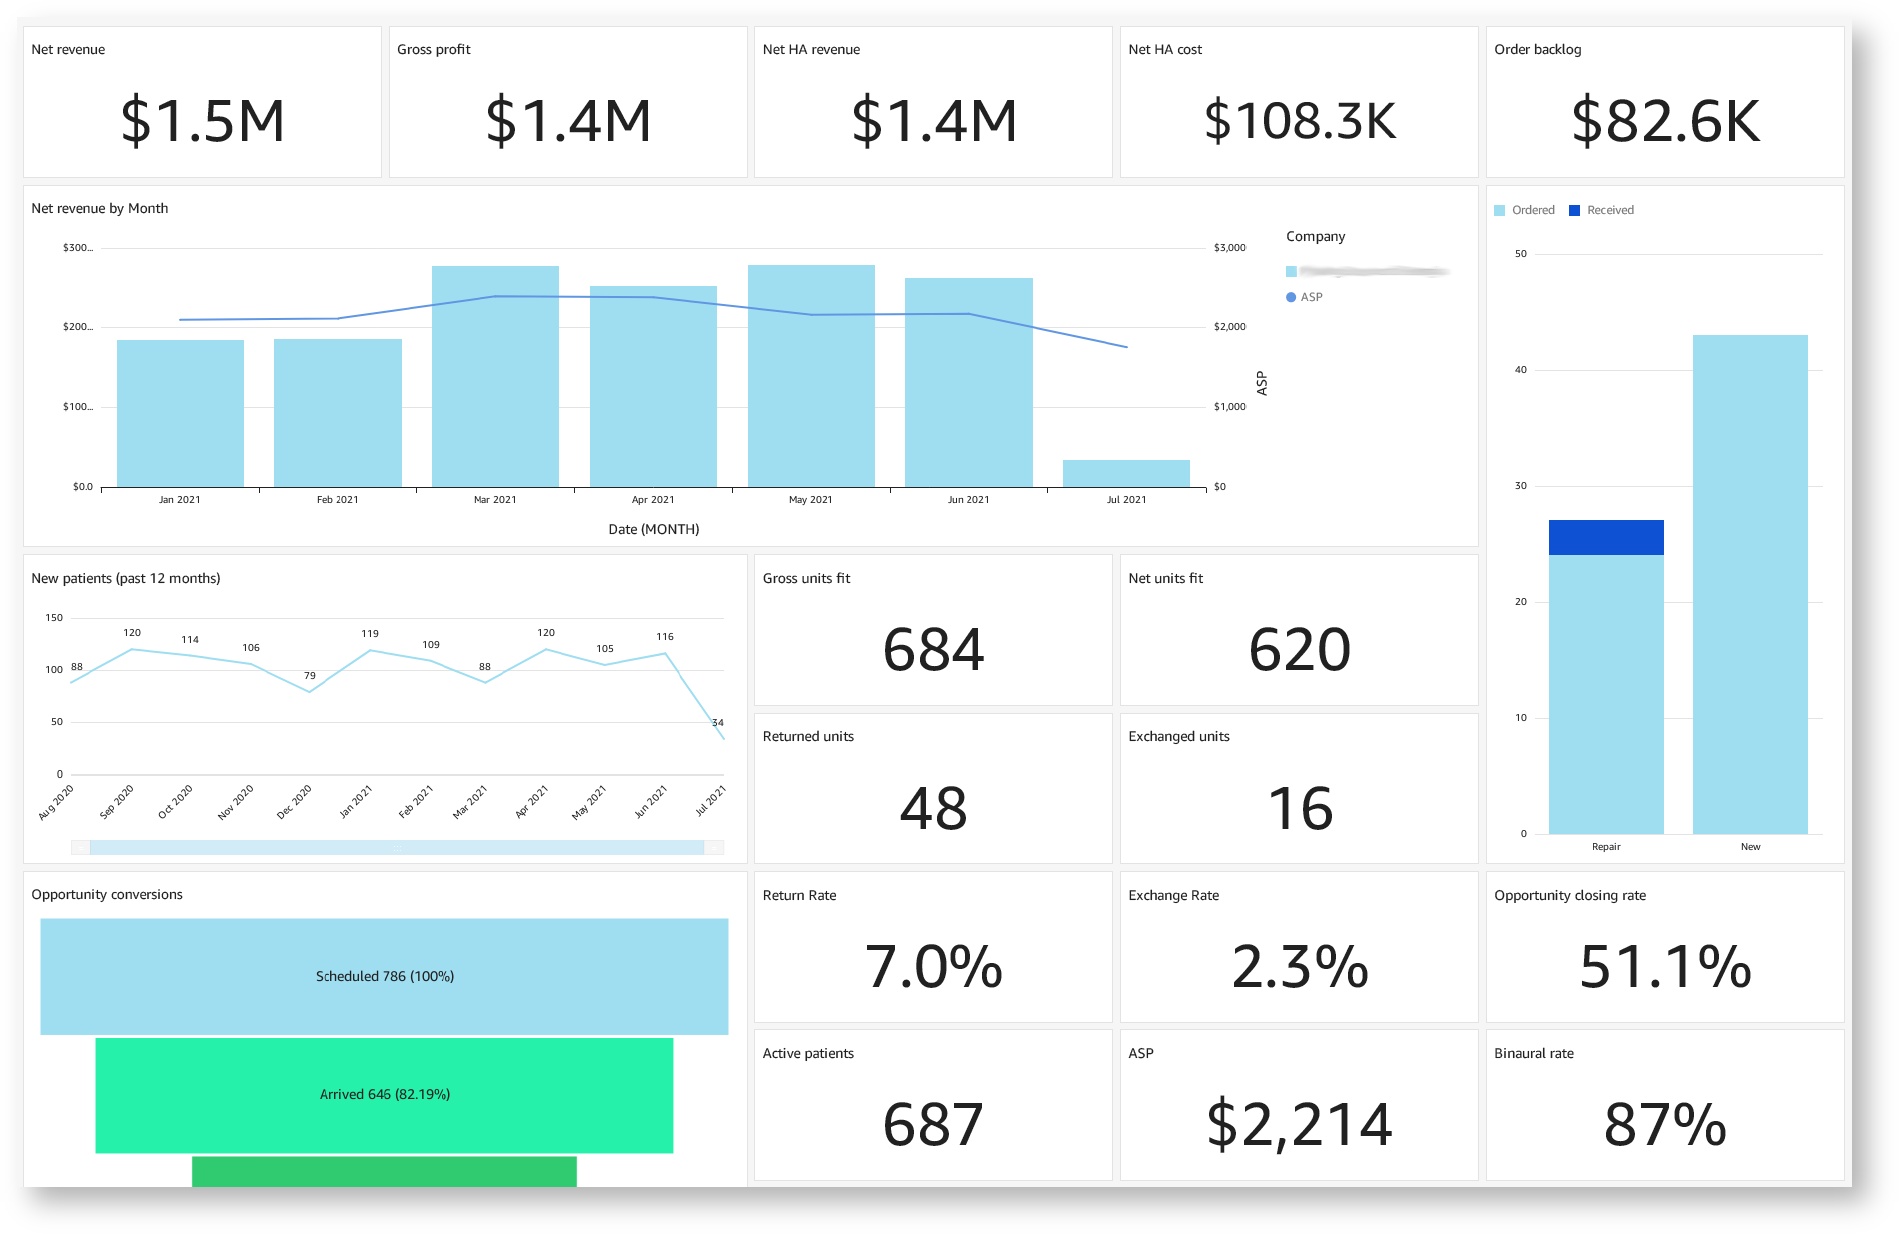
From a bird's eye view, to detailed breakdowns , Blueprint OMS dashboards will give you instant insight into your business.
Interactive data filtering and visuals will provide the answers to your most detailed (and revealing) questions, all in one place.

Interaction and data access controls
Users can use data filtering and metric selection on interactive dashboards. This makes it possible to view different data (for example for a different time period), and find answers for more specific, targeted questions.
Interactive dashboards can also automatically filter the underlying data to control or restrict the information visible to the user. For example, the dashboard could restrict user A to viewing data for a specific clinic location, or only show sales and appointment data relating to user A.
In order to access an interactive dashboard, the user will need to log in to the Dashboard portal with a username (email address) and password, and there is a monthly fee for each active username. (Of course, it is possible for multiple users to share a username, as long as the dashboard doesn't need to display different data based on the viewer's identity).
Automated delivery

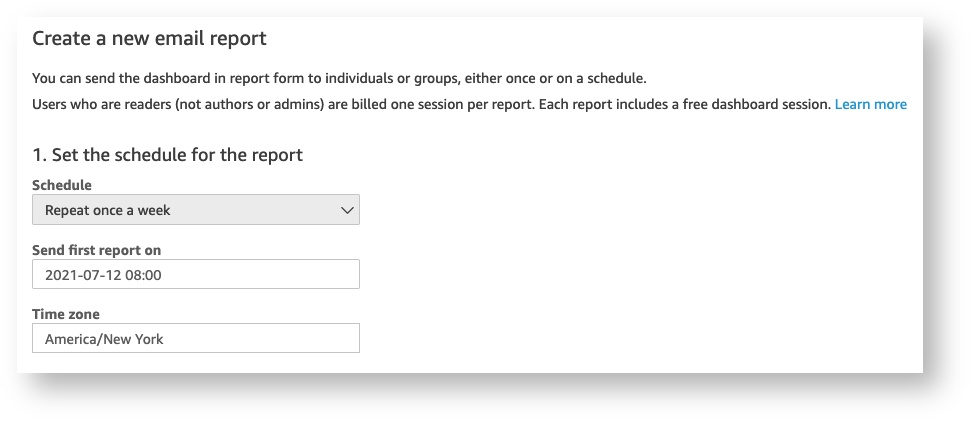
Automated delivery (via email) can be scheduled daily, weekly, or monthly. The email will include an image of the dashboard (which can be optimized for either desktop or mobile viewing) as well as an attached PDF version.
Please contact our technical support team if you would like to receive automated emails with your dashboard.
| Panel | ||||||
|---|---|---|---|---|---|---|
| ||||||
|
| Panel | ||||||||||||
|---|---|---|---|---|---|---|---|---|---|---|---|---|
| ||||||||||||
|
| Panel | ||||||
|---|---|---|---|---|---|---|
| ||||||